Richest Counties in Missouri (2026)
by Kristen Carney
Updated: February 9, 2026
Richest County in Missouri
The richest county in Missouri is St. Charles County with an average household income of $129,305 as of 2024 and 414,535 people as of 2024 according to the most current Census data available (citation).
| Rank | County | Population | Average Income | Median Income |
|---|---|---|---|---|
| 1 | St. Charles County | 414,535 | $129,305 | $104,692 |
| 2 | Platte County | 110,371 | $125,410 | $96,227 |
| 3 | St. Louis County | 995,569 | $123,036 | $82,936 |
| 4 | Clay County | 258,122 | $108,962 | $88,468 |
| 5 | Cass County | 110,773 | $108,544 | $87,535 |
| 6 | Christian County | 92,915 | $104,826 | $83,437 |
| 7 | Osage County | 13,402 | $103,237 | $76,681 |
| 8 | Lincoln County | 63,057 | $100,506 | $89,278 |
| 9 | Warren County | 37,177 | $99,746 | $81,209 |
| 10 | Boone County | 188,043 | $99,600 | $72,758 |
| 11 | Jefferson County | 229,458 | $98,813 | $82,851 |
| 12 | Cole County | 77,032 | $95,025 | $74,876 |
| 13 | Lafayette County | 33,115 | $93,896 | $80,612 |
| 14 | Franklin County | 105,950 | $92,432 | $73,165 |
| 15 | Ray County | 23,145 | $92,339 | $74,573 |
| 16 | Jackson County | 719,976 | $92,204 | $68,577 |
| 17 | Andrew County | 18,065 | $91,996 | $75,625 |
| 18 | Camden County | 43,667 | $91,825 | $66,387 |
| 19 | Adair County | 25,301 | $90,838 | $61,536 |
| 20 | Clinton County | 21,414 | $89,325 | $70,627 |
Median Income versus Average Income: Which Should You Use?
We usually suggest using median income data – either instead of or in addition to – average income data as a true indicator of wealth. If you haven’t thought about median versus average since your last standardized test, you aren’t alone. Here’s what they are:
- average is the sum of a set of numbers divided by the count of numbers in the set
- median is the middle number in the set of numbers
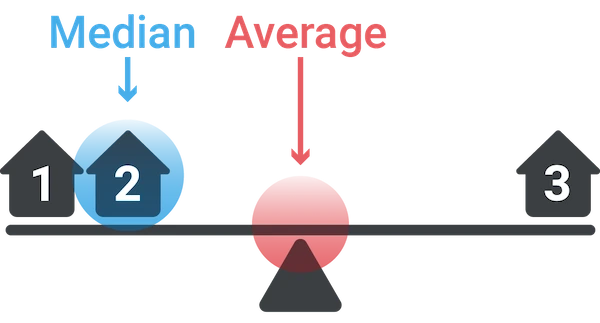
Now let’s say you had the following simplified set of income data.
Household 1: $30,000
Household 2: $50,000
Household 3: $1,000,000
The average income for this set is $360,000. The outlier data point ($1,000,000) skews the average WAY up. Conversely, the average income would be skewed WAY down if someone had an income of $500. The median income for the same data set is $50,000. Outlier data doesn’t skew the median.
Most Business Owners Should Use Median Income
So most business owners should use the median income as a true indicator of wealth, because it provides a more accurate representation of a typical income, especially in areas with significant income disparity.
When Should You Use Average Income
If your target market is high-income households, the average income may be more relevant. This is because the average income can highlight the presence of a higher concentration of wealthy individuals, which is beneficial for luxury goods and services marketing. We’re using average income on this page because using the Census’s highest reported median value of $250,001 could result in multiple ties for the richest geography.
Why do so many cities have a median value of $250,001?
The Census' American Community Survey uses $250,000+ as a jam value for median income estimates to protect privacy, ensure data consistency, and simplify reporting. A "jam value" in survey data refers to a placeholder or default value used when actual data points are unavailable, incomplete, or exceed certain thresholds. We represent this jam value as $250,001 to make it easy for you to sort.
You might also be interested in:
Email Me When New Data Are Released
Join thousands of subscribers and receive just 1 (ONE!) email a year in December when the US Census Bureau releases new income data for Missouri richest counties.
SOURCES
United States Census Bureau. Annual Estimates of the Resident Population: April 1, 2020 to July 1, 2024. U.S. Census Bureau, Population Division. Web. May 2025. http://www.census.gov/.
United States Census Bureau. B01001 SEX BY AGE, 2024 American Community Survey 5-Year Estimates. U.S. Census Bureau, American Community Survey Office. Web. 29 January 2026. http://www.census.gov/.
United States Census Bureau. B19013 Median Household Income, 2024 American Community Survey 5-Year Estimates. U.S. Census Bureau, American Community Survey Office. Web. 29 January 2026. http://www.census.gov/.
United States Census Bureau. “DP03 SELECTED ECONOMIC CHARACTERISTICS.” 2024 American Community Survey 5-Year Estimates. U.S. Census Bureau, American Community Survey Office. Web. 29 January 2026. http://www.census.gov/.
Products & Services
Plumbing
Connect
- 1-800-939-2130
- Contact Us
© Copyright 2026 Cubit Planning, Inc.